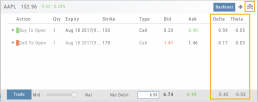
Delta & Theta Display on Template
You can expand the template to show Delta and Theta for the individual legs as well as the totals for the trade by clicking the ![]() icon on the upper right part of this screen.
icon on the upper right part of this screen.
This can help for faster evaluation and better positioning of the trade.
Elements of the Template
The Trade Finder Templates are designed to allow you to ‘visually trade’.
When evaluating a position, a Bull Put for example, the template automatically sets up the trade. You can use the rolling icons to adjust the position: Roll the position up/down, roll out the time frame, adjust the strikes, etc. You can even adjust the Net Credit(Debit) of the trade in an attempt to get a more favorable entry cost/credit.
The Performance Channels show the profit/loss of the position.
The P/L summary at the bottom left of the screen shows the Risk/Reward ratio, Net/Total Credit (Debit),the break-even stock price point, the max reward/max risk with corresponding stock price.
A snapshot on the right side of the screen, provides a visual structure of the strategy, what market 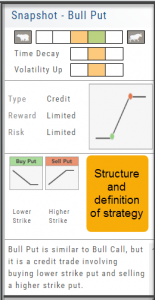 conditions are favorable to the trade, whether volatility and/or time positively, negatively or is neutralized by the strategy.
Greeks and Volatility are also shown.
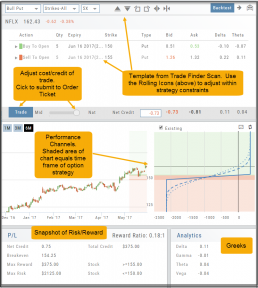
Once satisfied with the position set-up, click ‘Trade’ and the order will auto-fill in the “Order Ticket” of your brokerage account.
Important! While adjustments may to the template may be made, the system limits what can be changed in order to stay within the constraints of the strategy. This safety measure ensures you stay in the type of trade you intend to be in.
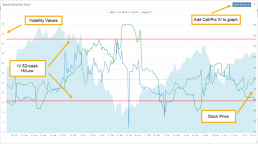
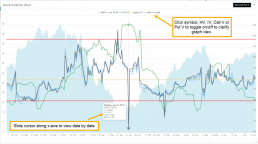
Historic & Implied Volatility
This chart displays Historic (HV) and Implied (IV) Volatility with the ability to overlay Call/Put IV
Historic Volatility (green line) is based on how the stock actually moved.
Implied Volatility (blue line) is based on how the options are priced.
When expanded, the stock chart, 12-Month Mean (Average) IV and one-year IV High/Low (red line) are also shown. This is very helpful in understanding if option premiums are comparable to historic values.
High HV indicates recent strong movement.
High IV indicates higher premium and, in many cases, anticipated movement.
Note: You can remove the Stock Chart, HV, IV or Call/Put IV simply by clicking on the corresponding indicator above the chart/graph.
Trading from Options Page & Strategy Templates
Structure and analyze any options position. When ready, click “Trade” to create and submit an Order Ticket.
Comparing trades with Snap? ![]()
Simply choose the structure you want then select “Trade” to send it to the Order Ticket.
Trading multi-leg positions is easier than ever!
