Bracket Order Adjustment
Adjust Limit and/or Stop Orders from the Chart
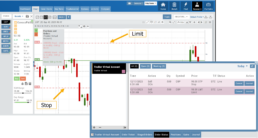
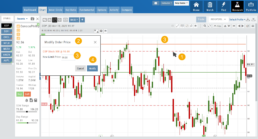
- Click on the Limit (or Stop) Order Dashed Line
- The Modify Order Price dialog box will appear
- Either move the dashed line to the new position, this will temporarily show up as a solid line. OR enter the new price in the dialog box.
- Click Modify
Once modified, the Limit order becomes a dashed line at the updated price.

26-01 Release Notes: Bracket Order Adjustment, Journal Reports, Show Confirmation
Adjust Limit and/or Stop Orders from the Chart
- Click on the Limit (or Stop) Order Dashed Line
- The Modify Order Price dialog box will appear
- Either move the dashed line to the new position, this will temporarily show up as a solid line. OR enter the new price in the dialog box.
- Click Modify
Once modified, the Limit order becomes a dashed line at the updated price.
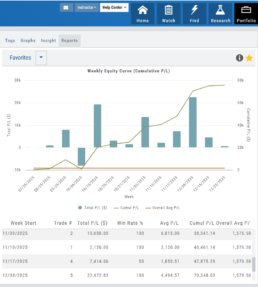
Journal Reports
Journal Reports transform your trading data into visual insights that highlight performance trends, behaviors, and outcomes at a glance. With intuitive charts and summaries, you can easily evaluate results, refine strategies, and build more consistent trading habits.
Show Order Status (Go to Order Ticket)
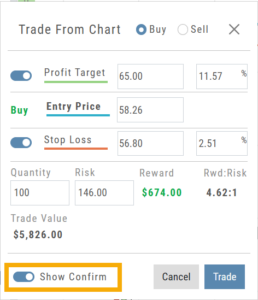
When trading from the Chart (OCO orders), you can elect to Show Confirmation – or not.
Toggling “On” will take you to the Order Ticket to review and submit your Order to the supporting brokerage.
The Order Ticket tab allows you to further adjust and even Stage the Order.
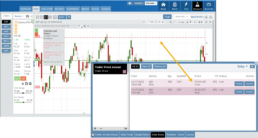
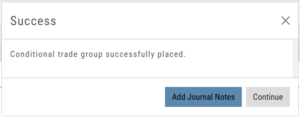
Once reviewed and submitted, you’ll get a confirmation the order was submitted, as shown here:
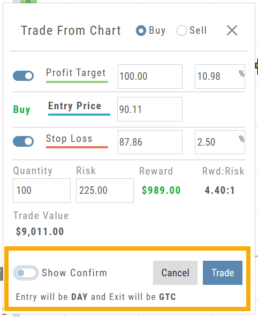
Toggling “Show Confirm” to Off, will bypass the Order Ticket window and convert the “Trade from the Charts” action to an Order Ticket itself.
Notice: The Entry is a Day Order, the Exit is a GTC order
Clicking “Submit” will send the order directly to the supporting brokerage.
Since the Order Ticket is bypassed, additional adjustments or Staging is not permitted when “Show Confirm” is in the “off” position.
Once submitted, as with “Show Confirm” activated, you’ll see this notice:
Journal Tab - Reports
Journal Reports
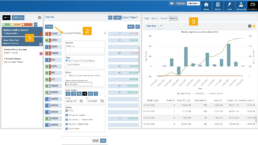
Understanding your trading performance shouldn’t require digging through spreadsheets or guesswork. Journal Reports turn your trading data into clear, visual insights—so you can quickly see what’s working, what’s not, and where to focus next.
With intuitive graphs and concise summary outlines, Journal Reports provide a high-level view of your account performance across multiple categories, helping you connect the dots between results, behavior, and decision-making.
Whether you’re reviewing weekly performance, refining your edge, or building better trading habits, Journal Reports transform raw data into actionable insight—at a glance.
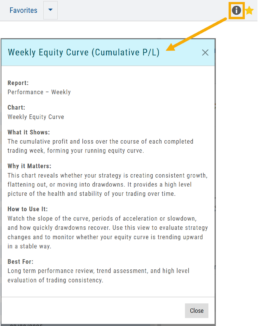
Click the Info Icon ![]() for a detailed outline on:
for a detailed outline on:
- What information the report provides
- Why it matters
- How to use it
- The application(s) the report is Best used for
Report Legend
Each Report has a legend where indicators can be toggled on/off simply by clicking on each one.
![]()
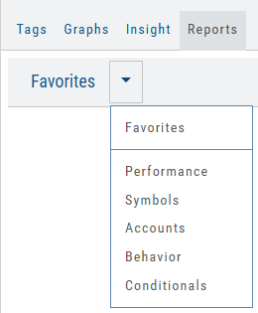
Journal Reports include insights by:
- Performance – Analyze results by time period to spot trends and consistency.
-
Symbols – Identify which tickers were your most and least profitable.
-
Account – Review performance across individual or multiple accounts.
- Behavior – See how trading habits impact outcomes.
-
Conditionals – Evaluate performance based on specific trade criteria or setups.
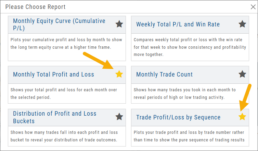
Click on one of the above categories, then click on the Report to display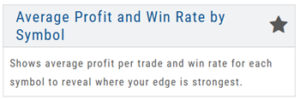
To make analysis even easier, users can group their Favorites into a single section—allowing you to focus on the symbols, strategies, or reports that matter most to you.
Simply, click the Star Icon to highlighteach Report to keep under “Favorites”
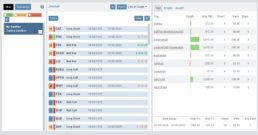
- The account(s) selected on the left side of the Portfolio Tab display the activity in the center panel for the default time period of 12 months
- Use the Filter Button to adjust the time period, symbols, etc to display
- The results from the center panel will be displayed on the right panel
Journal Tagging - OCO, Trailing Stops, etc.
OCO Journal Tagging
OCO Orders are automatically tagged in the Journal.
Once the Stock Order is Executed (it is an active Position), the Limit and Stop orders are Live (active Orders for the duration selected: Day or GTC.)
If/when the stock hits the Limit price, that order will execute, and the Stop order will be canceled. The Journal tab will be green and display a Gain/Profit.
-OR-
If/when the stock hits the Stop price, that order will execute and the Limit order will be canceled. The Journal tab will be red and display a Loss.
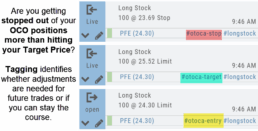
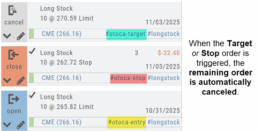
The tagged results show whether you’ve been hitting your target or getting stopped out.
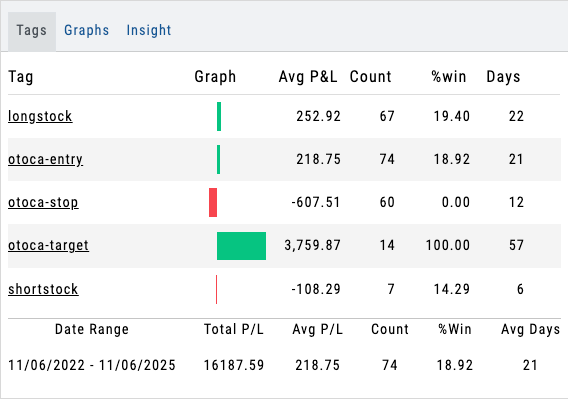
**Note: Past Conditional trades will be tagged as “otoca-entry”, “otoca-target” and “otoca-stop”.
Platform Features Release: Additional Features/Adjustments to Streamline Functionality
Announcing the latest Release of feature and functionality additions and enhancements to the trading platform to streamline/improve functionality.
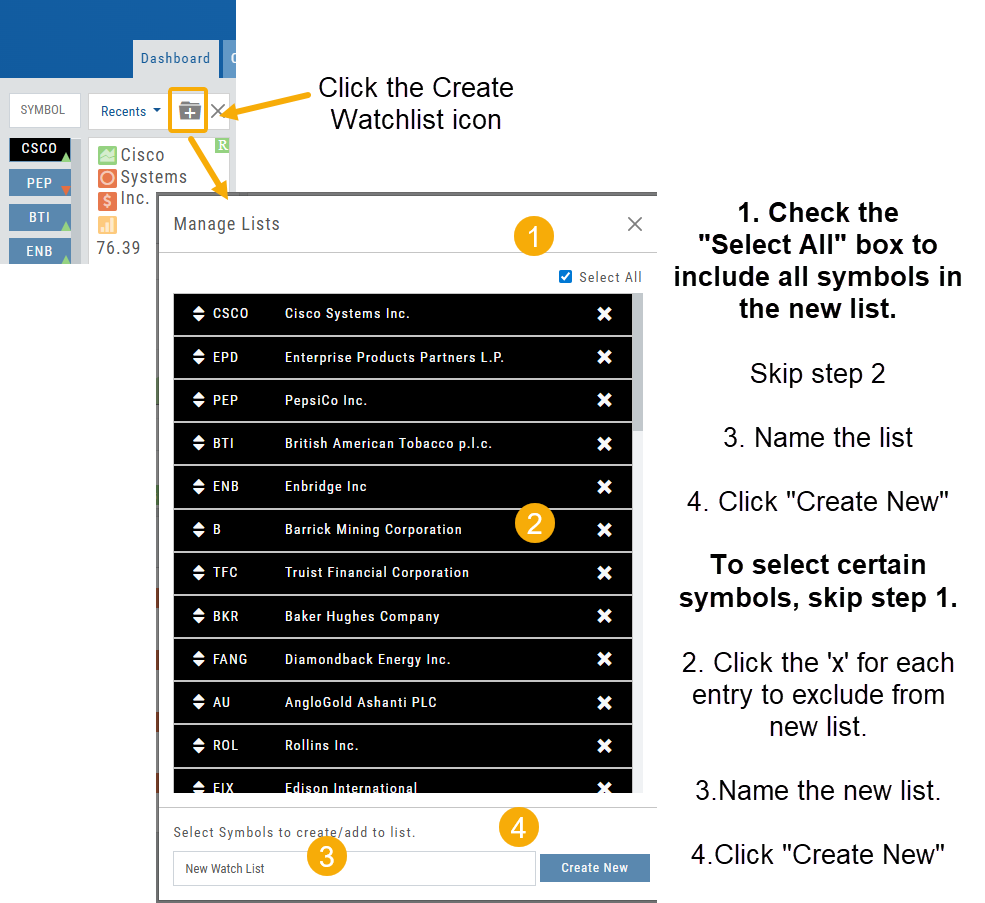
Build a Watch List from “Recent” List
Build a new Watchlist directly from the “Recent” list in Research.
Navigation Bar
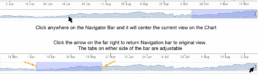
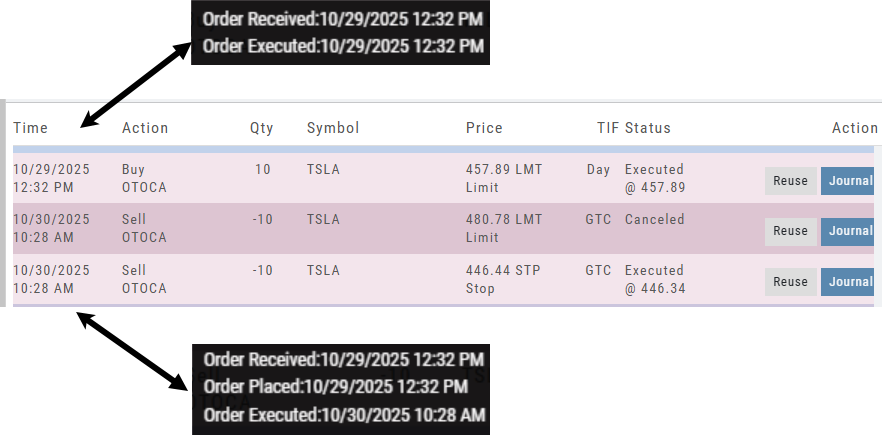
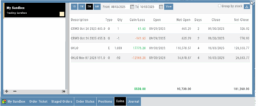
Order Status Time Stamp
Hover your cursor over the Order’s Date/Time info to display the Order’s activity Time Stamp.
Other Additions
- Enter a symbol, and it will appear in the symbol box. This works on any of the Research tabs.
- Adding a symbol when Creating a new Watchlist automatically adds to the list. The “Add” button has been removed.
Change Log
- Corrected “Close” action from Staged Trade
- Trailing % display corrected
- Renamed tooltip from “Add Watchlist” to “Create/Delete” vs. “Add/Delete”
Platform Features Release: Sandbox Trading Account, Order Status Filter & more
Announcing the latest Release of feature and functionality additions and enhancements to the trading platform to assist the investment/trading decision process.
Trading Sandbox Virtual Account
Announcing a new Virtual Account with fast execution, accurate tracking, and reliability you can depend on.
Unlike traditional broker-provided virtual accounts, the Sandbox is not bound by brokerage margin rules or limitations, giving you more freedom to practice and test strategies.
The Sandbox uses delayed market data. In addition to fast, reliable trade execution and accurate trade capture, it also handles options correctly, supports Conditional Orders for stocks, full Journal Support, and more!
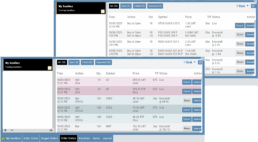
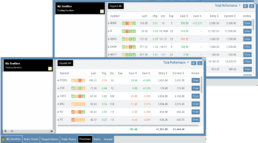
Order Status Filter Buttons
The Order Status Tab filter buttons make it easy to locate previous orders
![]()
- All – Everything in the time period is shown on the tab (Today, 1 Week, 1 Month, etc.).
- Open- Orders that have not yet executed as an active Trade/Position – includes Waiting Conditional orders.
- Working – Bracket orders where the underlying stock order is an active position (Stop/Limit orders). Excludes Waiting Conditional orders.
- Filled – Executed orders whether to open/modify/close
- Canceled – Includes both manually canceled as well as day orders that did not get filled prior to the end of the Market Day
OCO Journal Tagging
OCO Orders are automatically tagged in the Journal.
Once the Stock Order is Executed (it is an active Position), the Limit and Stop orders are Live (active Orders for the duration selected: Day or GTC.)
If/when the stock hits the Limit price, that order will execute, and the Stop order will be canceled. The Journal tab will be green and display a Gain/Profit.
-OR-
If/when the stock hits the Stop price, that order will execute and the Limit order will be canceled. The Journal tab will be red and display a Loss.
**Note: Past Conditional trades will be tagged as “otoca-entry”, “otoca-target” and “otoca-stop”.
Delayed Streaming Quotes
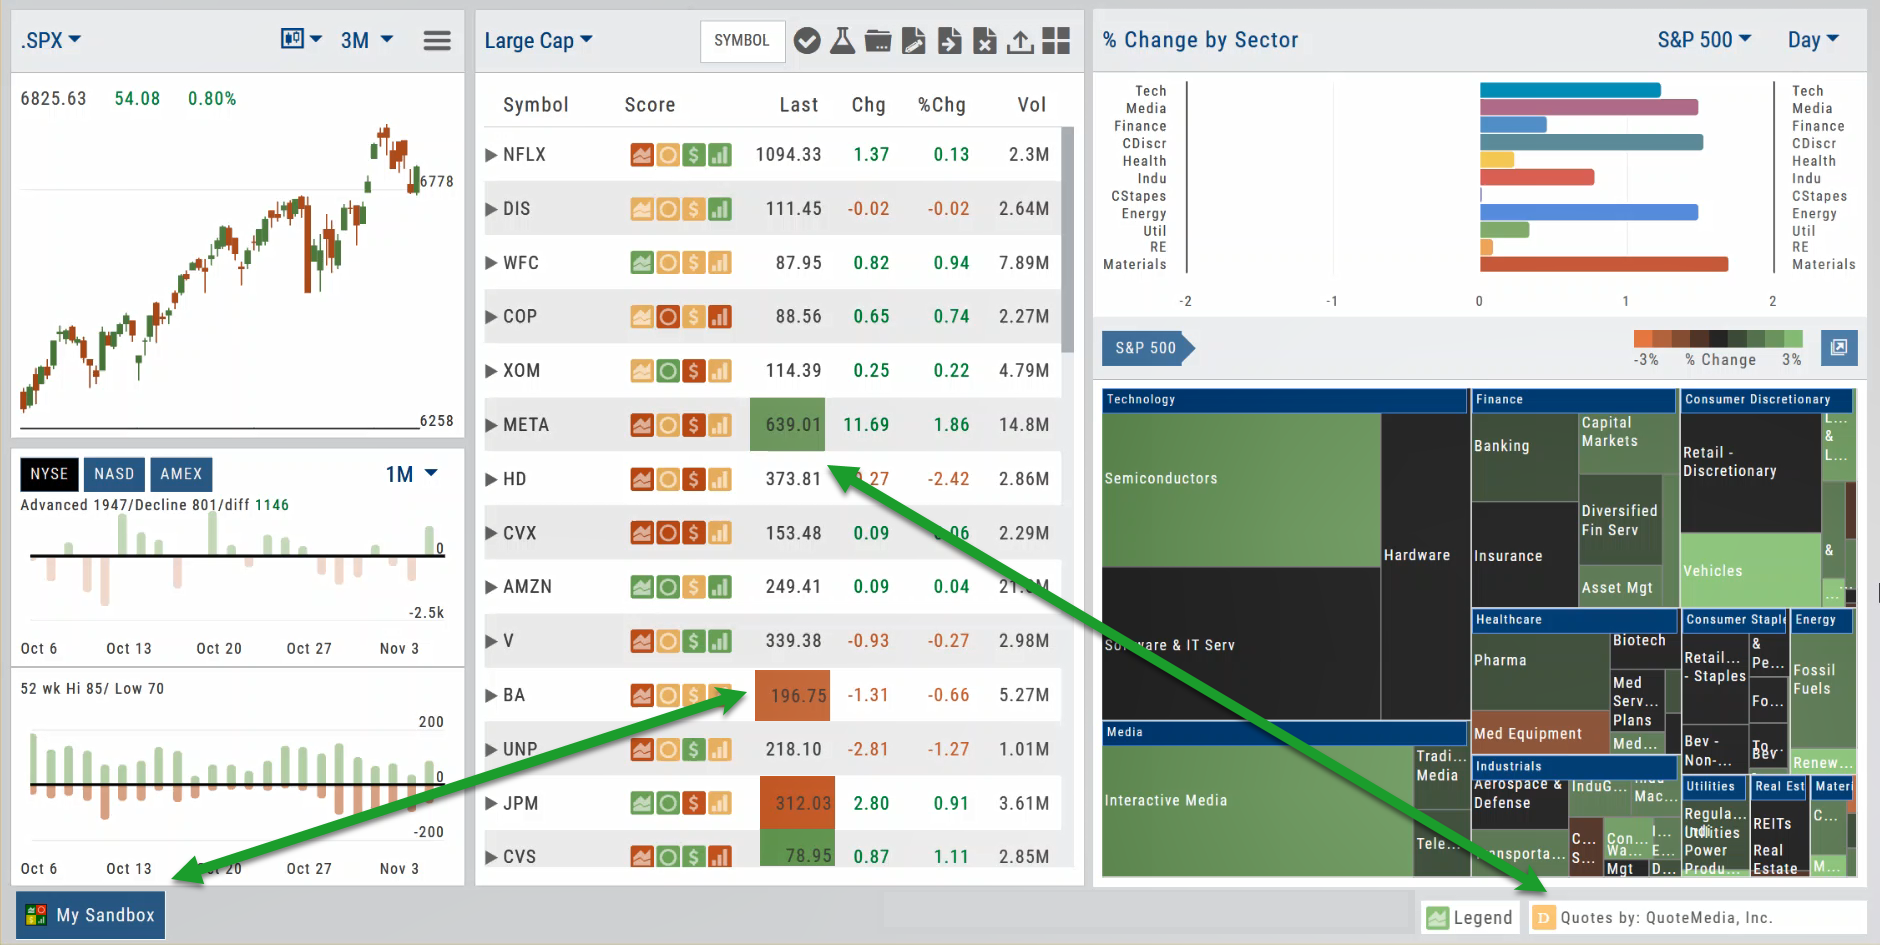
Delayed Streaming Quotes will appear when you have a Virtual or Manual Account activated.
Click on the account tab so that it appears on the bottom left corner of your screen.
Extend Fibonacci Retracements on Charts
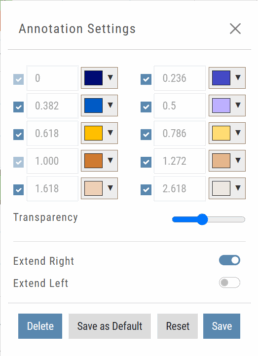
Fibonacci retracements can be extended right and/or left on the chart.
Click an existing Fibonacci annotation, then use the toggle switches to adjust it.
Don’t forget to “Save”
Note: Extend Right/Left can be edited/saved individually, not Set As Default.
Chart crosshairs
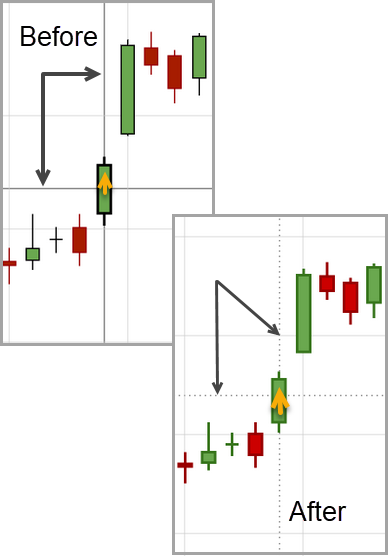
The cursor crosshairs on the chart have been adjusted so they no longer obscure the candlestick wicks
Other Additions
- Set “GTC” as default duration for Exit Order on Trade Ticket
- Modify TTM Squeeze formula to follow industry
- Auto-select Option Cycles for existing Order(s)
Change Log
- Resolved Screener glitch to move candidates to selected watch list
Platform Features Release: New Zoom Functionality, Chart Panning
Announcing the latest Release of feature and functionality additions and enhancements to the trading platform to assist the investment/trading decision process.
New Zoom Functionality
To activate Zoom, click on the Zoom button has been added to the icon toolbar:
![]()
- Once activated, the button changes color.
- Click/drag the mouse/cursor over the area of study.
- A “Reset Zoom” button will display when you want to restore the view.
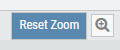
Chart Panning Functionality
Click/drag now pans the time period/price range on the chart – when dragging your mouse/cursor either right/left
Other Additions
- “Choppiness Index” Chart Lower Indictor added
- “Are You Sure You Want To Cancel This Order?” added on Order Status tab
- Clicking on “Quotes By” box (lower right corner) will display source of quotes
Change Log
- Reuse .XSP and .SPX order functionality restored
- Trading Block OTM trade error fixed
- Schwab recognizes BRK.B now
- Resolved Liquidity Range in Screener
Trading Sandbox Account - Overview
Unlike traditional broker-provided virtual accounts, the Sandbox is not bound by brokerage margin rules or limitations, giving you more freedom to practice and test strategies.
Trading Sandbox Account was built specifically to overcome these shortcomings, allowing traders to:
-
Test advanced strategies without brokerage-imposed limits.
-
Gain confidence in how options positions will behave through expiration and assignment.
-
Track true results on completed trades for more effective learning and analysis.
As with other simulated trading systems, the Sandbox uses delayed market data. However, it goes beyond conventional paper trading platforms in several key areas:
Fast & Reliable Order Execution
Orders are processed quickly during market hours, creating a more realistic trading experience compared to laggy paper trading systems.
Supports Conditional Orders for Stocks
Effortlessly include Stop and Limit Orders when buying stock.
Options Handling That Works
Options are properly assigned and exercised as they would be in a real account, removing the gaps found in most brokerage simulators.
Accurate Trade Capture
The Sandbox records and captures gains/losses on completed trades, giving you a clear picture of how your strategies perform over time.
Full Journal Support
When auto-journaled (default setting) is set, all activity is captured. Track your progress to see what strategies work, what needs more practice, for important feedback.
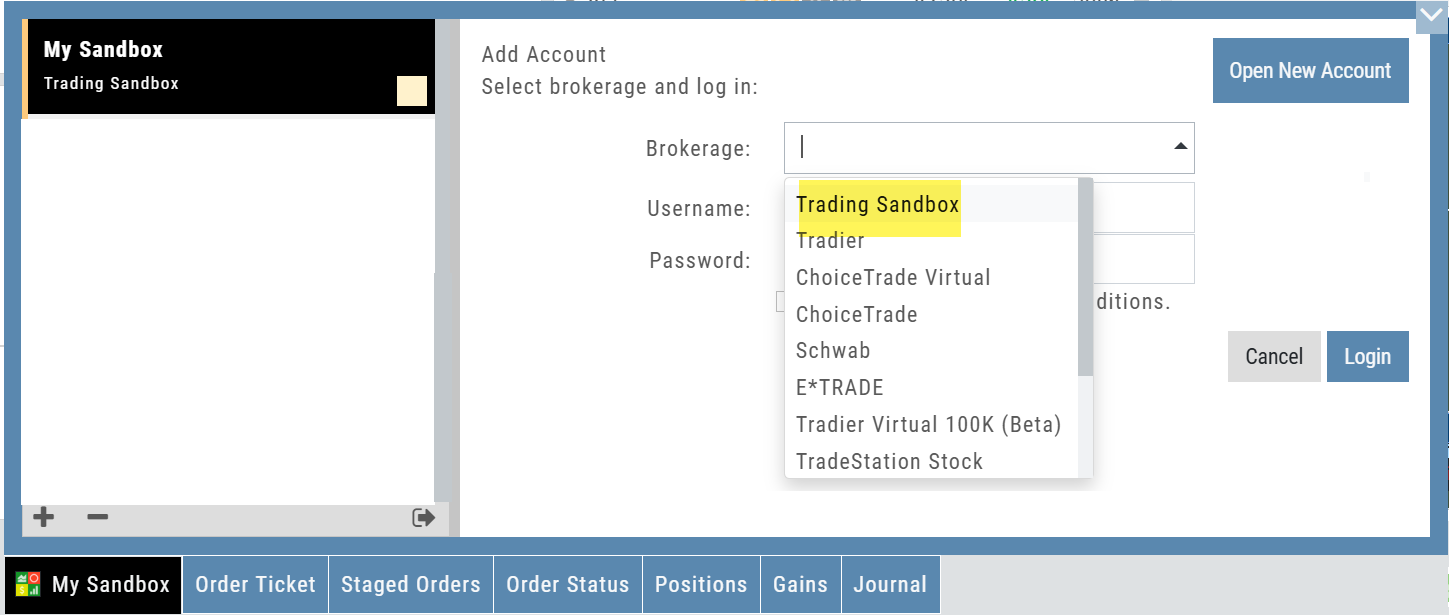
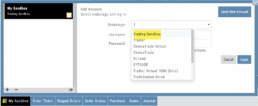
How To Add:
Sandbox has been added as a drop-down selection in the Portfolio section of your trading platform
-
Click the bottom left corner tab of the platform to display all account tabs
-
Click the “+” icon appearing below these tabs
-
Select “Sandbox” from the dropdown list. Check the “I agree…” box
-
Name your account and select a color identifier, if desired.
-
Start trading!
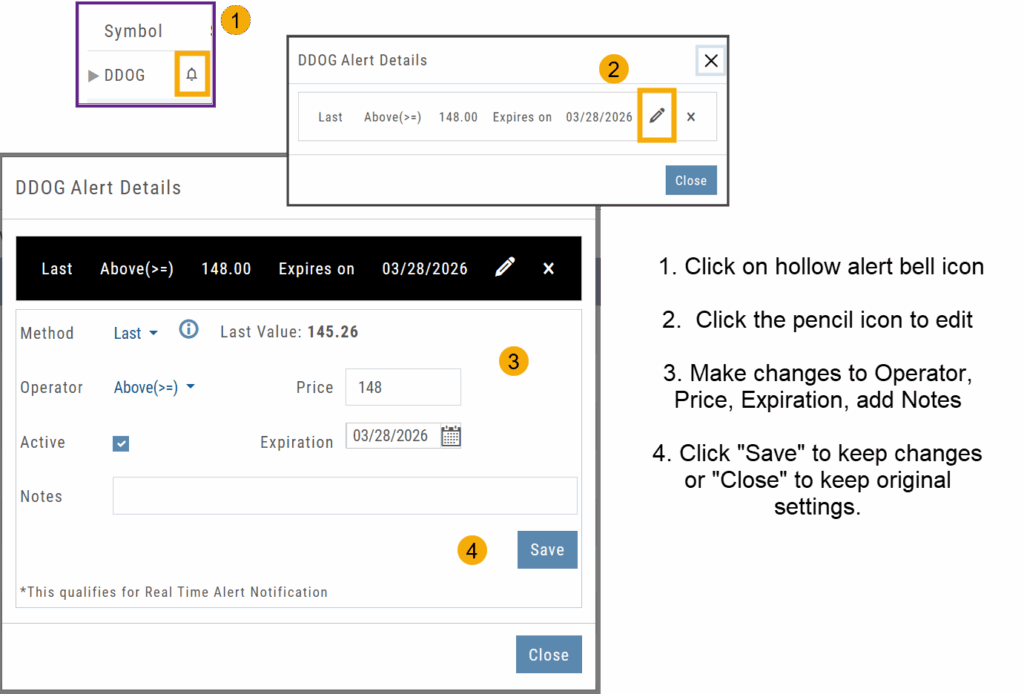
Platform Features Release: Alert and Chart Feature Enhancements
Announcing the latest Release of Charting and Alert enhancements.
Edit Alerts from any Accessible Screen
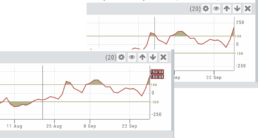
Price Info added to Go Big Chart View
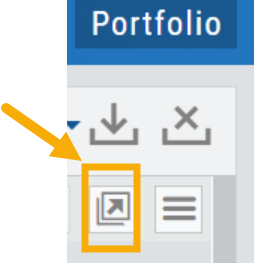
Last, Bid, and Ask values have been added to the Big Chart window, with Trade capability
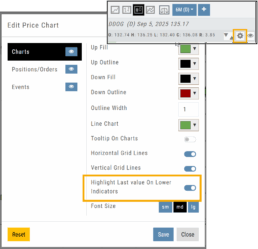
Price Chart Control
Toggle switch on/off to show/hide last value of certain lower indicators.
Change Log
- Price Slices bug fix
- Brokerages to set Virtual Account Limits
Platform Features Release: Annotation Enhancements, Condor Trade Set Up
Announcing the latest Release of Annotation improvements and Strategy template adjustment. We’ve also made several practical changes for better access to features/functions.
Independent Default Settings for Annotations
When adding Annotations such as lines, rays, arrows, etc, to the chart, the settings for that type of annotation can be set as a “Default”. Line settings are independent of other annotations’ settings.
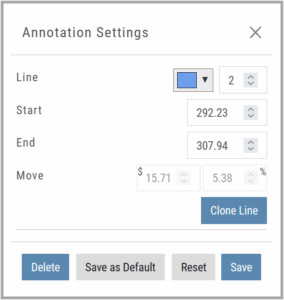
Add the Annotation.
Click on the annotation to display the Dialog box (shown).
Make any adjustments.
Click “Save as Default”
The newly added and future annotations of the same type will have the new settings.
Click “Reset” to revert to original settings.
Fibonacci Too!
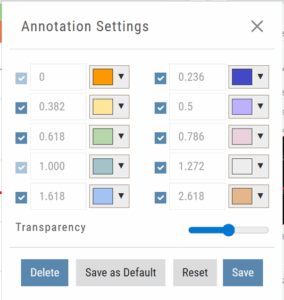 The Fibonacci Annotation has been enhanced to allow you to select which Retracement Levels you want to view in addition to adjusting the color for each as well as transparency overall.
The settings can be set as the Default for new chart entries.
**Please note: Existing Fibonacci annotations cannot be edited with this new coding. They must be deleted, then added back.
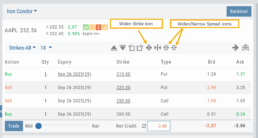
Condor Strategy Template Adjustment
The core functionality of Condor Strategy Templates has been adjusted. (Iron/Long/Short)
The center strikes are now anchored by default and will only change if you adjust them manually on the template itself or by using the “Widen Strike” icon —making trade construction more intuitive and consistent.
Widening/Narrowing of the center Strikes will change the spread of the Condor, which can be done manually on the template or by using the “Widen” or “Narrow Spread” icon.
Other Additions
- EOD lower Indicators will display “Chart Unavailable for intraday charts.”
- Zoom feature now includes a double-click “on-off” functionality
- HeatMap legend (Find>HeatMap) is movable
Change Log
- Heatmap legend is no longer fixed when clicked to view
- Transparency for shapes is resolved
- Price slice functionality adjusted for price changes
- Zoom feature is now toggle functionality
- Scrolling chart/arrow functionality resolved